Workload Profiling & Benchmarking
Structured performance analysis using real jobs and targeted benchmarks.
Many clusters run a mix of commercial solvers, in-house codes and data-processing pipelines. Without profiling, it is difficult to know where optimisation effort should go. This service provides a clear picture by combining real-job traces with focused benchmarks.
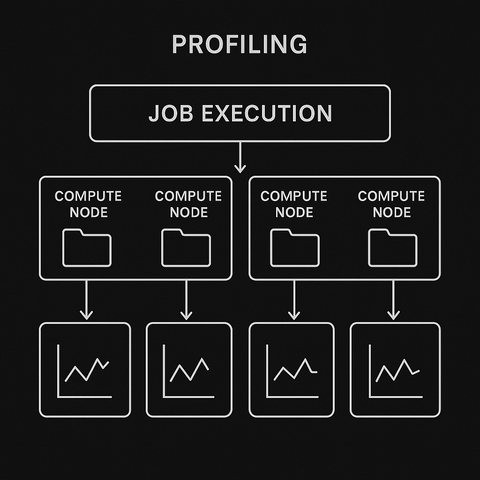
Using tools such as perf, eBPF-based tracing, Intel VTune, NVIDIA Nsight and application-level timers, we capture CPU, memory, GPU and I/O behaviour of representative workloads. We complement this with standard benchmarks like HPL, STREAM, fio or IOzone to understand hardware limits.
The result is a report that highlights the largest bottlenecks, quantifies their impact and proposes prioritised changes at the application, library or system level.

Case study – Focusing effort where it really matters
A research group suspected that their solver was limited by CPU speed and requested faster nodes. Profiling showed that the dominant bottleneck was actually a single-threaded pre-processing stage and inefficient I/O of temporary files.
After modest changes to their workflow and some I/O tuning on the cluster, the overall time-to-solution decreased significantly without buying any new hardware. The group could then justify future investments with a clear performance baseline.
